
“We finish in March.”
A date, without a measure of confidence.Project schedule risk, made legible
A date isn’t
a forecast.
A programme says March. RiSiQ shows how much confidence belongs behind that date — and what could move it.
Think of it as a weather forecast for your project.
No credit or debit card required
Schedule forecast
One date. A range of outcomes.
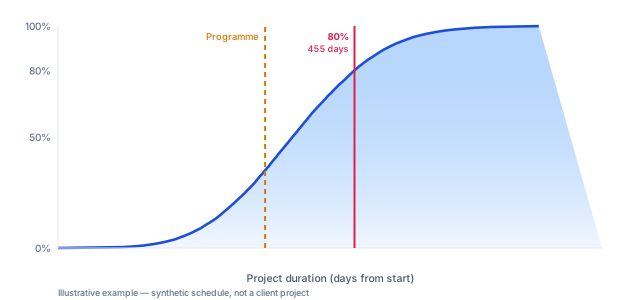
Programme date~35% confidence
80% finish date455 days
A schedule gives you a date.
A forecast tells you how much to trust it.
01 — The forecast
“It’s on track.”
At what probability?
A schedule gives you a date. RiSiQ gives you a way to judge how much to trust it — so a forecast can inform the decision, instead of dressing an estimate up as a promise.
“An 80% chance of finishing by March.”
Confidence, made explicit.02 — What you actually get
Three things to take
into the next meeting.
A clearer view of the date, the drivers and the cost — without pretending there is no uncertainty.
01
A percentage, not just a date
See the chance of finishing by your target — not only the target the programme prints.
FINISH-DATE CONFIDENCE
Programme
~35%80% date
455 days
~35%80% date
455 days
02
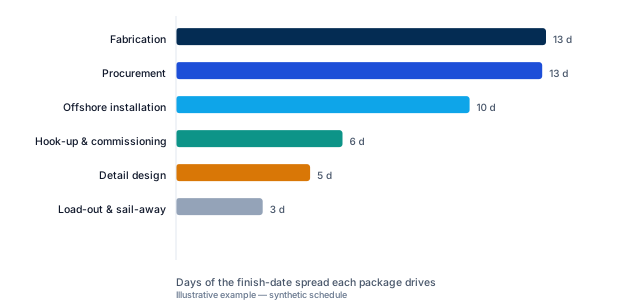
The few things that move the finish
Of the many things that could go wrong, three or four can move the end date most. RiSiQ ranks those drivers and shows their impact in days, so effort goes where it can help.
03
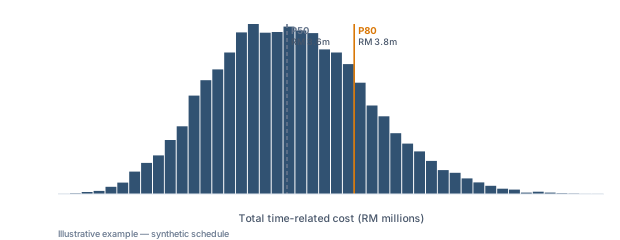
The price of delay, in ringgit
Understand what being three months late could cost, in a number you can take to a board, a bank or a client.
And a written report
See what RiSiQ can show
Bring the assessment — not just the date.
Executive summary, S-curve, cost distribution, joint confidence, work-package health and ranked drivers. Ready to put in front of a board, a bank or a client.
03 — Why it matters
Better questions.
Better choices.
The point isn’t to predict the future with certainty. It’s to make the uncertainty useful before you commit to a decision.
“On track at what probability?”
Replace a reassuring nod with a number you can discuss.
“What’s your independent view?”
When a contractor asks for more time, bring your own assessment to the conversation.
“What does each option cost?”
Compare accepting a delay with paying to avoid it — before you choose.
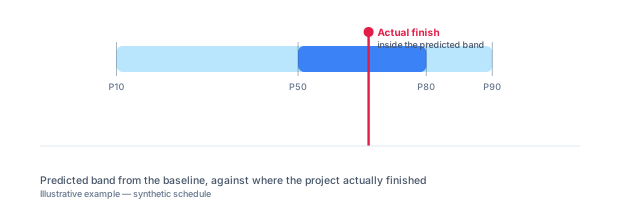
BACKTEST · COMPLETED PROJECT
04 — Start with evidence
Test the forecast
before you trust it.
Use a project that has already finished. Give RiSiQ the programme as it stood two years ago. See whether it would have warned you — before you pay anything.
Create an account to test a project05 — Built for trust
Honest about
what it can’t know.
A useful forecast earns trust by showing where it is weak — not by pretending to be certain.
Not a verdict on your contractor
RiSiQ won’t tell you whether someone is dishonest.
Not a replacement for project leadership
It informs the person running the project; it does not replace them.
Concurrent risks can be understated
When several things go wrong together — bad weather, a supplier failure and a short crew — RiSiQ may understate the risk rather than overstate it. The report says so.
Entry tier — Start with evidence
Start where
the risk is.
A fraction of what a consultant charges for the same analysis — an analysis many projects skip because it is too expensive to justify.
No payment before you test it.
No promised outcome — just a forecast to judge.
No promised outcome — just a forecast to judge.
BasicFor your next decision
30-day free trialRM 599/ month
RM 3,420 / 6 monthsRM 6,500 / year
- ✓1 project
- ✓5 users
- ✓3 reports per month
Trial: 1 user · 1 project · 3 reports per month. No card required and no overage charge.
MAKE “WE HOPE” ACTIONABLE80% — and here’s
80% — and here’s
what would make it 90%.
Illustrative wording, not a forecast result. A sentence you can act on in a meeting.